The Base of the System
The Base of the System
The crop yield prediction system is based on the agronomic model AquaCrop (4.0). An Agronomic model is, generally speaking, a software that allows us to simulate crops development. The model uses diferent input sources such as climatic data, soil information, tillage methods and crop development stages (phenology).

AquaCrop has been developed by FAO (Food and Agriculture Organization) and is especially adjusted for places where water is the main limiting factor for crop production.
AquaCrop, in this case, runs in its most basic configuration, that is, it only uses, as input data, climatic data, soil information and crop development stages. Just rain feed crops are considered: winter wheat and barley. Rain feed crops means that the water supply they get, comes from the rain entirely. On the other hand, since the main goal of the project is to give an idea about the crop yield at large scale, punctual diseases, bad health of the crops or any other kind of these issues are not taken into account.
Planning of the Simulation
Planning of the Simulation
Although the methodology is not difficult, it needs to be understood to interpret the results correctly.
The general framework of the methodology is based on the execution of AquaCrop at fixed locations over the regional area. On the other hand, two different kind of executions are carried out: the first one for calibration and the second one for current season simulation. The main different between both executions is the set of climatic data that takes part in each one. Therefore, and summarizing, we can identify three aspects in the methodology: the locations where AquaCrop will run or geographic component, the calibration of the model and the execution of the prediction for the current season.
GEOGRAPHIC COMPONENT
The first aspect to consider is the geographic locations to run AquaCrop at. In this sense, and with the purpose of running the model in all region, a 2 Km x 2 Km regular point grid was created covering the entire region. Since every point in this grid becomes an execution point, they need to have all input variables to run AquaCrop: Climatic data, soil information and phenology of the crop. Phenology is considered to be constant for all points. Climatic data and soil data are interpolated to each location by mean of geostatistic methods.
The climatic data are interpolated from about 200 meteorological stations. These stations belong to two different networks: AEMET and Inforiego (ITACYL). The latter is within SIAR Network (MAGRAMA). The source of the soil information is the Soil Sample Database of Castilla y León and is available for downloading on the Web site http://suelos.itacyl.es/.
More information about all these data and their sources can be found down on this same Web page.
CALIBRATION OF THE MODEL
To predict the crop yield of the current season, we need to know how well AquaCrop results estimate the actual yield in the past years. That is, the model needs to be calibrated.
In this sense, what we consider the actual yield is the reported value in the Survey of Acreage and Crop Yields in Spain (Encuesta de Superficies y Rendimientos de Cultivos de España, ESYRCE). More information about this survey can be found down on this same site in Source of the input data.
The AquaCrop calibration is made by using the climatic data of the last thirty years. These data come from the historical Database of AEMET. Therefore, AquaCrop is run with each year climatic data and then, the result is compared with the one reported by ESYRCE database at the same location. This comparation allows us to fit a linear relationship between ESYRCE data and AquaCrop results which tend to overestimate the yield of the crop, in other words AquaCrop result is scaled by mean of a linear relationship. To be precise, both ESYRCE data and AquaCrop results are averaged by year and province and then are correlated to find the linear relationship, that is, an empirical scaling formula. This formula is used in the current season for the prediction step as it is explained down.
EXECUTION OF THE PREDICTION FOR THE CURRENT SEASON
Every fifteen days, the agronomic model is run the same way that it has been run in the calibration step, that is, AquaCrop is run at every location in the 2 km x 2 km regular grid. The main difference between calibration and prediction execution is how the climatic data for the agronomic model are composed. Apart from that, the rest of the input data, soil information and phenology stages, remain as they were in the calibration step. Since the agronomic model is meant to run untill the end of the season, climatic data need to be composed to that date. This composition is made this way:
- From the starting of the season (1st of october) to the date of the launch of the Bulletin, climatic data from AEMET and Inforiego are collected and interpolated to the 2 km x 2km regular grid. Therefore, they are actual data of the current season.
- From the date of the launch of the Bulletin launch, ten days deterministic meteorological predicction is added to the previous data set. This prediction comes from the European Centre for Medium-Range Weather Forecast (ECMWF).
- And, finally, from here to the end of the season (1st of july) a set of historical climatic data is added. This historical database stores data of the last 30 years.
This process allows us to obtain 30 possible yields for each location in the regular grid. Now, to get the predicted yield, the empirical formula obtained in the calibration step is applied to the yield obtained at each location. In this sense the results gather all possible climatic variability of the historical serie and, therefore, a set of possible climatic scenarios can be defined, from the driest to the wettest one. As the season goes on, the current climatic data become more important in the final result and historical ones lose importance. Thus, the result of the possible scenarios will be the same value in the last execution, the one on the first of july.
The last step is to aggregate the results by province. The fact of using a regular grid allows identifying locations within each province. Nevertheless not all areas in the same province have the same crop intensity. So, to avoid areas with low or null crop intensity having great influence in the result, a weighted mean is applied.The weighted mean takes into account the acreage of each crop within the 2 km x 2 km grid. The acreage comes from the Castile an Leon Crops and Natural Land Map.
Source of the input data
Source of the input data
The Bulletin has the following structure:
AGROMETEOROLOGICAL STATION NETWORK OF ITACYL-MAGRAMA (SIAR NETWORK) AND AEMET.
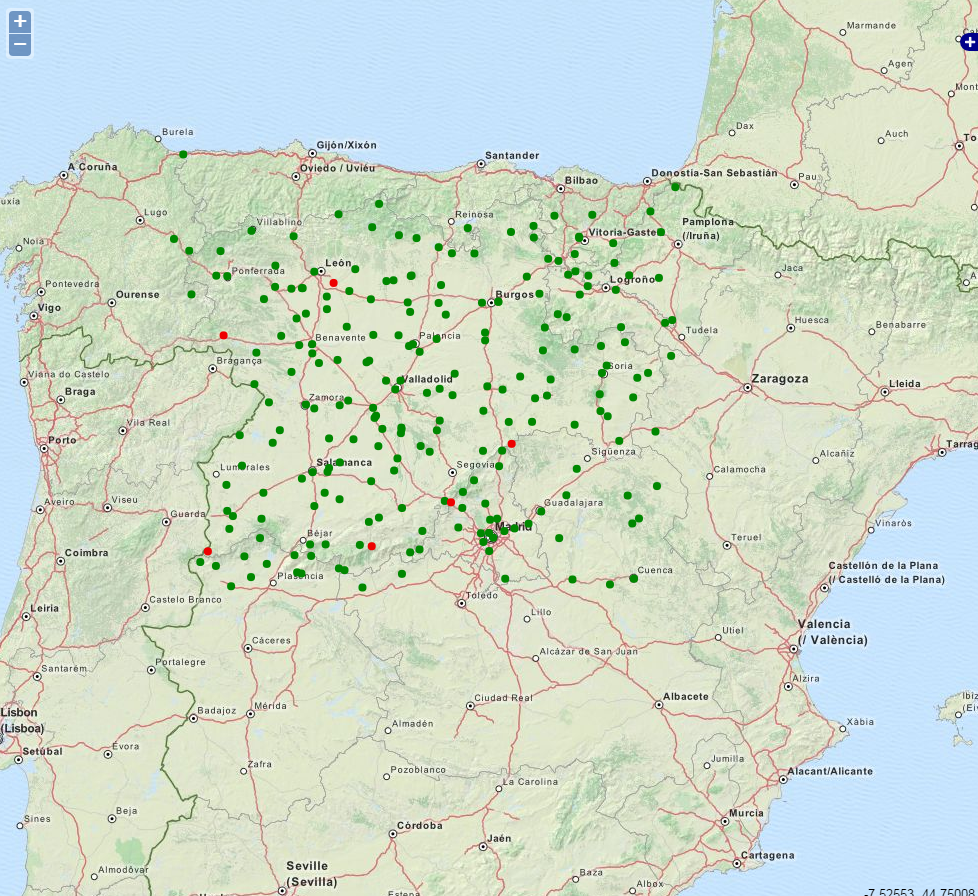
Meteteorological data (rainfall, evapotranspiration and temperature regime) is one of the bases for the agronomic model to run every day. It was necesary for all these data from different networks -AEMET network and SIAR in CyL network (ITACyL-MAGRAMA)- to be integrated and standarized. While only about 200 automatic stations were used for the simulation of the current season, more than 500 stations were used for the setting of the 30 year climatic scenarios. The latter data came from AEMET's historical database.
SOIL SAMPLE DATA BASE OF CASTILE AND LEON (ITACyL)
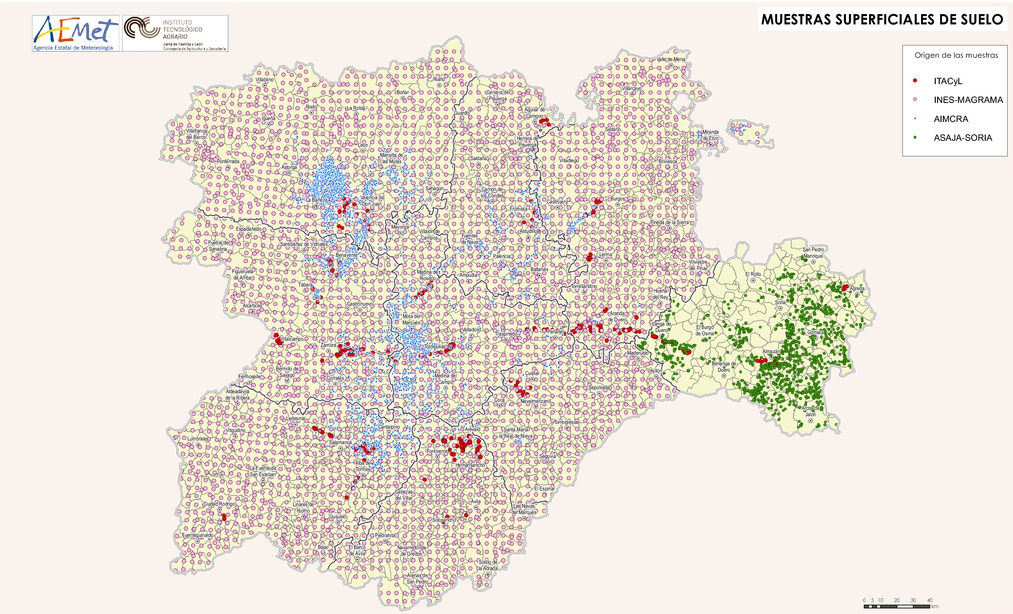
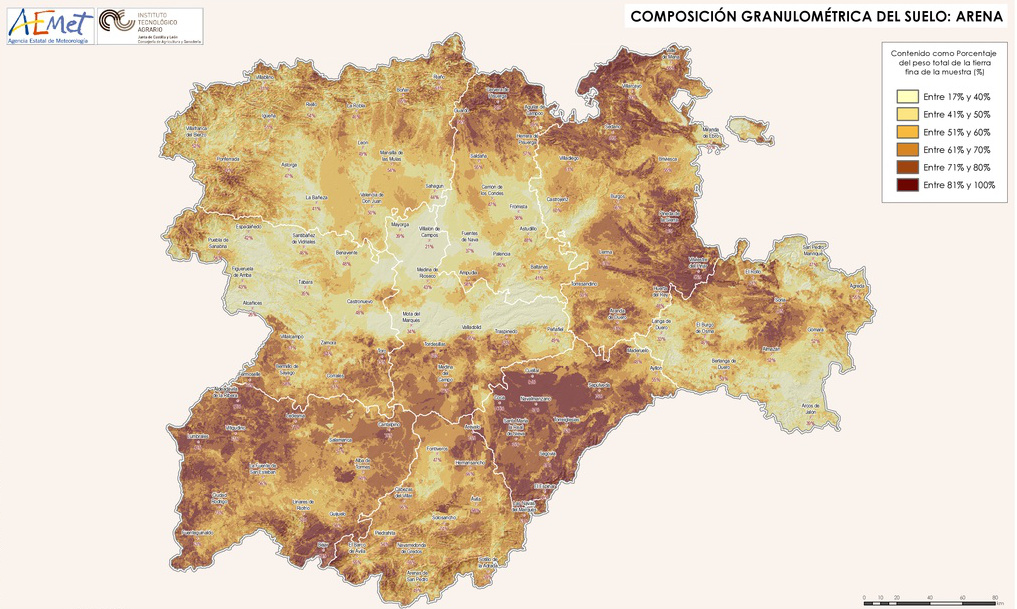
ITACyL has lead this project since 2011. Its main purpose is to collect, organize and standardize all available information on soil properties in Castile and Leon. This database stores more than 12.000 samples from the first 30 cm depth of each location. All samples have, among many other properties, information on textural properties. These textural caracteristics are interpolated to each location in the 2 km x 2 km regular grid by mean of geostatistic methods, in this case Regression-Kriging. Nevertheless, AquaCrop needs hidraulic properties of the soil such as permeability and soil water content to run. Therefore, changing from textural to hydraulic properties was needed. Pedotransfer functions were used for this change. All these data are available for downloading from its web site: www.suelos.itacyl.es.
SURVEY OF ACREAGE AND CROP YIELDS IN SPAIN (MAGRAMA-JCyL)
The regional Ministry of Agriculture colaborates with the national Ministry of Agriculture to carry out this survey on Acreage and Crop Yields. This survey has been made every year since 1990. It is a data frame survey, that is, 700 m x 700 m georeferenced frames are visited from may to august seeing the present crops on each frame and the acreage for each one. Besides, Information about the expected yield is collected on some of these frames. The result of this survey is the most objective one that can be found and the base of many other official reports.
CASTILE AND LEON CROPS AND NATURAL LAND MAP (ITACYL)
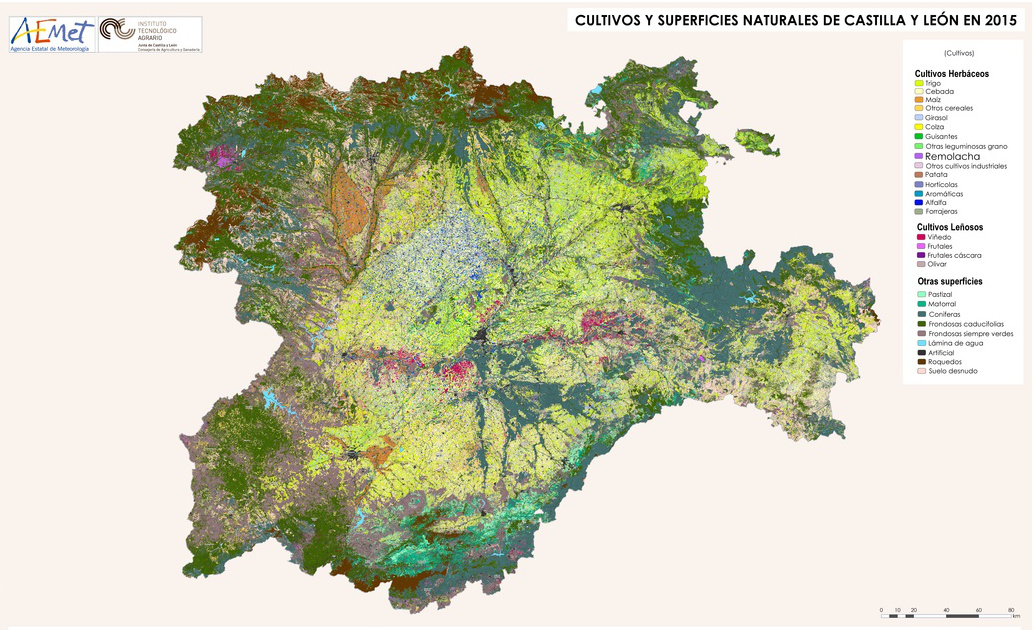
Castile and Leon crops and natural land map (MCSNCyL, spanish acronym) is a land use layer, updated annually, obtained through satellite imagery. The goal of the project is to produce a land and use map that represents the changes in annual arable crops as well as permanent crops and the areas of natural vegetation. The project began in 2013, and since then layers 2011, 2012, 2013, 2014 and 2015 have been generated.
ACREAGE OF CROPS ESTIMATION (REGIONAL MINISTRY OF AGRICULTURE OF CASTILE AND LEON)
The regional Ministry of Agriculture of Castile and Leon carries out a estimation on the acreage of the main crops acreage in the region. This information is reported every month. The first report for winter cereals is made in october. The acreage estimation in the first reports is not very reliable because the season is just started. Nevertheless, as the season goes by, the acreage estimation becomes more reliable as long as the information from european subsidaries is added.
Investigación y Desarrollo
Investigación y Desarrollo
PROYECTO MEDSCOPE
Dentro del proyecto ERA4CS MEDSCOPE en el que participa AEMET, se ha desarrollado un prototipo que pretende mejorar el sistema utilizado hasta ahora, que hace uso de la climatología desde abril hasta junio, para obtener la predicción de cereales de invierno, por un prototipo que a comienzos de la primavera utilice la regionalización de las predicciones estacionales del modelo System-5 del ECMWF para abril-mayo-junio. Ello ha conllevado además de la regionalización de los campos de predicción estacional, el rediseño completo del sistema que funciona actualmente y también de su postproceso y verificación, además de la evaluación de los resultados obtenidos en comparación con el sistema actual.
Una vez evaluados los resultados, durante la próxima campaña 2020-2021, se correrán de manera simultánea ambos prototipos, mostrando los resultados mas adecuados.
Se puede encontrar más información sobre el proyecto MEDSCOPE en la Web: https://www.medscope-project.eu/
